1. Our principles
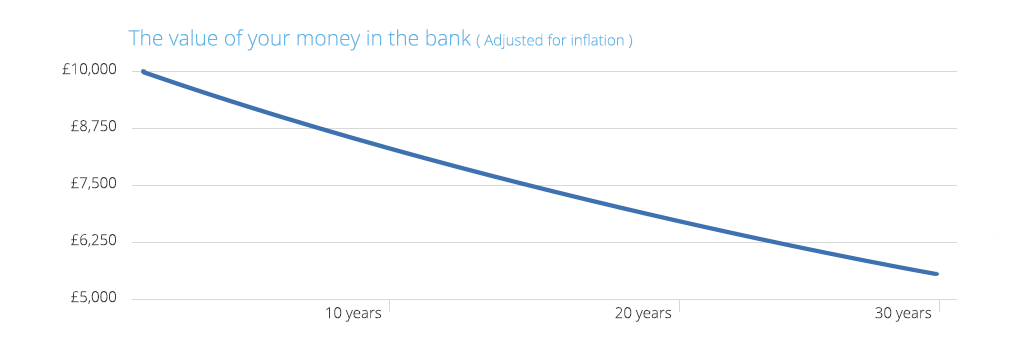
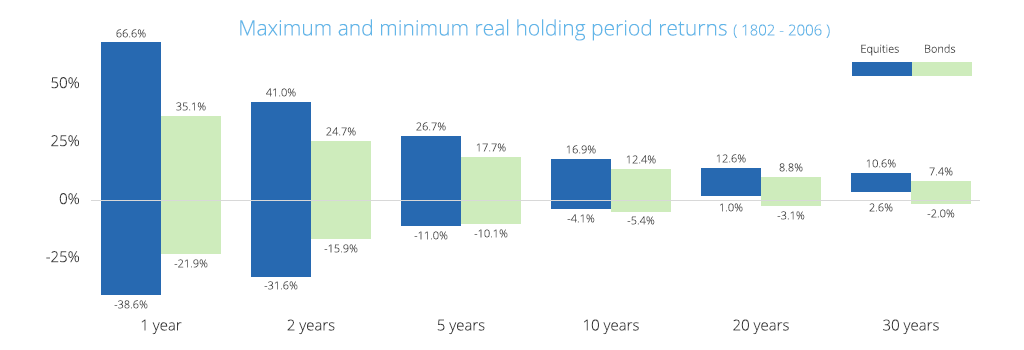
Through our series of blog posts we have shared what we believe are the general truths that are applicable to investing. This includes the ample evidence that in general asset allocation trumps stock picking. We've covered why we believe ETFs are a good way of investing, and how important it is to pick a strategy that you are comfortable with and then stick with it. The value of saving and investing for the long term, how passive investment instruments usually deliver better returns than actively managed ones. We've delved into how this difference is magnified by how we as humans have an unwarranted belief in our ability to pick the winners and to time the market, and how important costs are to investment returns.
We've also talked about how we are challenging investment assumptions and have analysed the flaws of the traditional definition of risk profiling and how a different approach can be used to better tailor portfolios to clients needs.
This updated white paper explains how we have tied all of these concepts together in our approach to investment management. Beginning with asset allocation we also describe our portfolio implementation, trading and rebalancing.
From the start our objective has been to build the most tailored and transparent online investment offering, and with this paper we aim to provide you with all the details you need to understand how your money will be managed.
2. Asset allocation
ETFmatic offers portfolios with exposure to two major asset classes: equities and bonds.
Equities
Equity instruments grant ownership in a company/companies. This exposure or what is commonly know as a share, is expected to be worth the future earnings one can expect from the company. Earnings generally tend to grow over time for a variety of reasons and, depending on the company region and period of time, can exhibit moderate to high levels of volatility.
In a growing economic environment, with low interest rates and inflation, equities tend to perform well as the companies that make up the stock market grow due to their increasing revenues and profits.
Bonds
Government bonds grant exposure to government credit and interest rate risk, but are most often less volatile than equities, as these instruments are backed by the full faith and credit of a government and have fixed and known income streams for investors (the coupon and final redemption payments are known). They have historically been classified as lower risk investments.
The two asset classes tend to exhibit a low correlation with one another over longer periods of time. In a growing economic environment, earnings and profits grow and the shares of companies tend to do well. When investors are risk averse, they tend to allocate to bonds given their fixed payments and limited expected downside. These fundamentally different economic streams of returns (the variability of equities returns versus the fixed nature of bonds) means that historically, these asset classes have been suitable for diversification. Combining two asset classes that provide different streams of risks and returns in different economic environments means your overall portfolio should offer better risk-adjusted returns.
Other
ETFmatic has chosen not to include other asset classes (notably commodities and precious metals, real-estate, or other alternative investment instruments) in our universe.
While there are definite benefits to holding commodities within a portfolio we don’t think that the implementation offered through swap-based products, narrow Exchange-Traded Commodities (ETCs) or active funds that charge high fees justify their inclusion. Given our focus on simplicity we also don’t think it merits investing in futures to gain exposure to the asset class.
We expect that most of our clients will have some form of exposure to their local real estate market. While we do not want to get into a debate around diversification or hedging of said exposure, we believe that the overall diversification through the broad equity indices is enough for a long term portfolio.
2.1. Asset Classes
Within the two broad asset classes of equities and bonds, we have chosen to target broad indices replicating major markets.
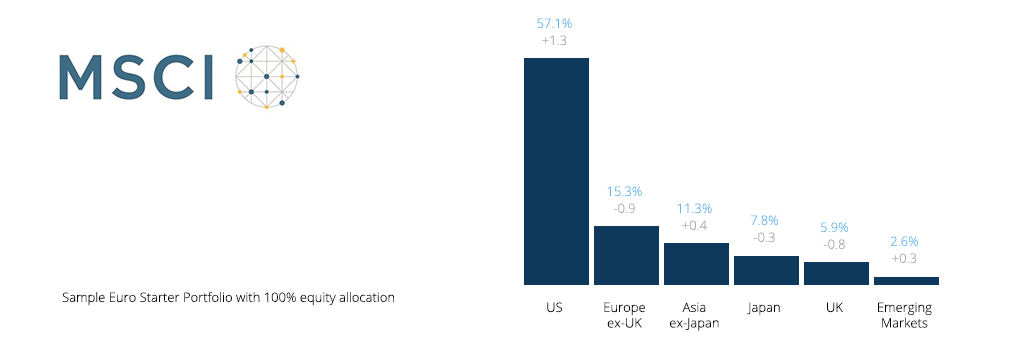
On the equity side we have identified six broad indices that taken together represent more than 97% of world’s investable equity markets.
On the fixed income side we use two main broad indices for each currency. The first, and most important one, is a government bond index for the home currency. The second varies depending on currency, as can be seen in the table below.
2.2. Index selection
The specific indices we have identified for each currency can be found in the following table .
2.2.1. Currency Hedging
Currency exposure adds volatility which implies the possibility of both better and worse returns. Currency hedging is a way to protect against the worse returns.
Within equities, research indicates that over the longer term there can be no difference between hedged or unhedged returns. We further believe that equities tend to have natural hedging properties within the instrument. When you invest in a company that has product and services all over the world, their different foreign earnings streams will be subject to many different currency movements. When these companies report earnings in local currency they undertake hedging themselves to protect from adverse foreign exchange movements.
We therefore chose to use unhedged indices on the equity side in order to achieve an exposure to all opportunities in each target region, including local market returns and their currency effects.
As bonds provide investors with fixed streams of returns in a particular currency, we believe not having this income stream in an investor’s base currency could seriously affect the final value of the investment. As the main purpose of a bond allocation has traditionally been to serve as “safe” assets we have opted to buy hedged bond ETFs wherever necessary.
3. Portfolio Construction - Three approaches
We believe that everyone deserves an individually managed portfolio. We also recognise that at this stage of the industry’s evolution, not everyone will feel comfortable handing over total control to an algorithm.
For this reason we offer our clients three categories of portfolios - Starter Portfolios, Custom Portfolios and what we call Investment Plans. All three categories use the same asset classes, and trade the same ETFs. All are managed individually. The big difference is that in Investment Plans you decide how dynamic your portfolio management should be in responding to what’s happening in markets, and how the asset allocation should adapt to where you are in the the life cycle of your investment.
3.1. Starter Portfolios
Starter Portfolios are very straight-forward to set up while still giving the client some control over the overall asset allocation. Clients simply select a split of equity and bonds which are suitable for them based on three broad risk categories: Conservative, Balanced and Aggressive asset allocations. More conservative asset allocations will have a higher allocation to bonds (historically safer investments) while more aggressive portfolios will have a higher allocation to equities (growth assets).
Within the equity portion, we allocate to various regions based on the market cap weighting across the indices (see previous section for overview of the indices we use). Within the bond section of the portfolio we allocate 80% to the local government bonds and 20% to the second index.
The Starter Portfolios allows our customers the following benefits:
- A straightforward portfolio management solution
- The ability to select the most suitable profile given their risk and return objectives.
- Setting a precise asset allocation, from 0 to 100% invested in equities/bonds.
- Rebalancing their portfolios correctly with increased contributions.
- Not having to worry about the index selection, ETF implementation, tax-efficient rebalancing and ensuring that the portfolio maintains its’ risk profile as markets and asset classes adapt and change.
The disadvantage with allowing a client to only choose a bond/equity allocation that matches their risk profile is that the portfolio won’t necessarily reflect all their unique preferences. That is why we have designed our Investment Plans.
3.2. Investment Plans ("Dynamic Portfolios")
Two investors with similar risk profiles could have different demands around how their portfolio should respond in case of market movements. This means that despite both being conservative investors the asset allocation for each client will be different when constructing a portfolio to match their needs.
Investment Plans or, as we also refer to them, our Dynamic Portfolios, try to address this by providing a more scientific approach to portfolio construction.
Our Investment Plans construct Dynamic Portfolios using Modern Portfolio Theory (MPT) to create portfolios that are tailored to each client. Modern Portfolio Theory is a widely accepted framework for the construction of investment portfolios.
We let our clients configure their portfolios in three different dimensions, and use this to match a client to an appropriate asset allocation. The dimensions are Exposure, Patience, and Time Horizon.
3.2.1. Exposure
The Exposure setting is a very straightforward way of selecting eight positions on an efficient frontier that is constructed from historical data (“less risk” to “more risk”).
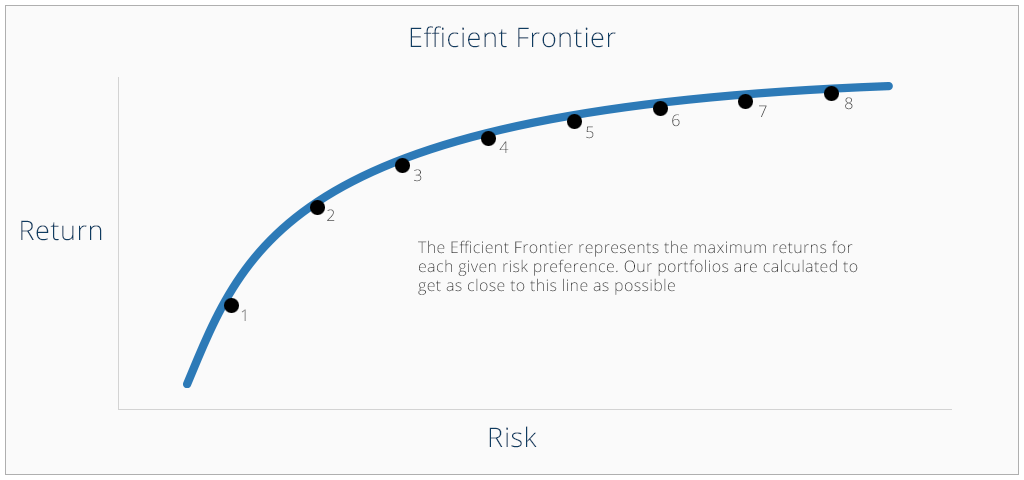
(Charts are for illustrative purposes only and no based on real numbers)
The Exposure setting serves as a proxy for the level of risk and volatility of your asset allocation. The higher the level of exposure, and therefore volatility, the greater range of possible returns. Higher volatility, all else equal, historically has meant greater expected returns. Lower volatility, all else equal, historically has meant lower expected returns.
The market exposure setting should not be viewed in isolation as it is combined with your "Patience" and "Time Horizon" settings in order to find the appropriate asset allocation for your portfolio.
As indicative numbers for the different Exposure settings, the following are historical ranges of volatility for the different allocations:
| Exposure | Volatility typically between | Up to | |
|---|---|---|---|
| 1 | 3.8% | 5.2% | 6.5% |
| 2 | 4.3% | 5.4% | 7.5% |
| 3 | 4.9% | 6.2% | 9.3% |
| 4 | 5.6% | 7.6% | 10.3% |
| 5 | 5.3% | 9.8% | 15.6% |
| 6 | 5.4% | 11.4% | 19.8% |
| 7 | 5.6% | 11.9% | 19.8% |
| 8 | 5.7% | 12.6% | 19.8% |
3.2.2. Patience
The Patience setting determines how long of an estimation window is used when constructing and rebalancing your portfolio, which impacts the magnitude of the changes that are made to your portfolio’s target asset allocation.
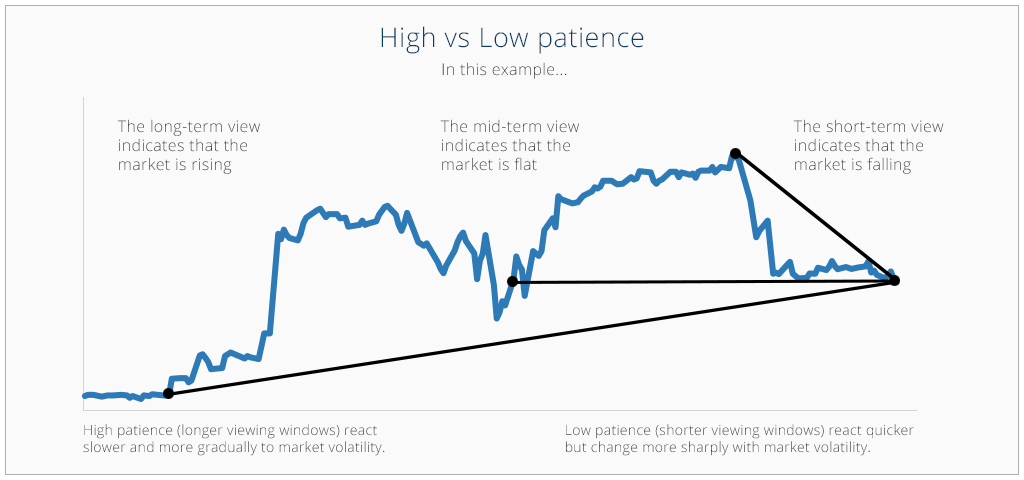
(Charts are for illustrative purposes only and no based on real numbers)
The greater your Patience, the less your target asset allocation will move with market changes. The less your Patience, the greater the allocations will be adjusted due to market movements. Your Patience setting will therefore have a significant impact on the target percentage allocations of the various assets classes held in your portfolio from one week to another. When you change this setting, it determines how far back into the past we look to calculate trends, correlations, historical returns and volatility.
For the shortest Patience setting, the typical change in equity or bond allocations from one week to another could range from around 3% to 17%, but it can go up to 30% or more in extreme circumstances.
For the longest Patience setting, typical changes in equity or bond allocations from one week to another could range from 0% to 2%, but can go up to 10% or more in extreme circumstances.
Please note these numbers are only indicative and are very much determined by asset class and market returns, which can have extreme weekly and daily movements.
It is very likely that a portfolio with a short Patience setting that is held in a taxable account will have large rebalancing adjustments. This may trigger us to sell assets as part of the rebalancing, which will have tax consequences.
A portfolio with a long Patience setting that is held in a taxable account is less likely to have large rebalancing adjustments, and it is therefore less likely to trigger selling as part of the rebalancing.
3.2.3. Time Horizon
When our clients configure an Investment Plan, they are able to select a Time Horizon for the investment. This is effectively when redemption of the investments in some form will become necessary. The Dynamic Portfolio engine uses the Time Horizon to create a "glide path” for the portfolio. This means the portfolio will dynamically increase the allocation to safer assets and decrease the allocation to riskier assets as the portfolio approaches the target date, in order to protect the final portfolio value.
One can think of this process as shifting the asset allocation from assets that historically have grown over time to assets that have historically protected value over time. The reason for this is obvious, as you get closer to funding that house purchase, college education or retirement, the final portfolio value becomes incredibly important, and although riskier asset classes provide the potential for greater final returns, they also provide the potential for variability in returns and risk.
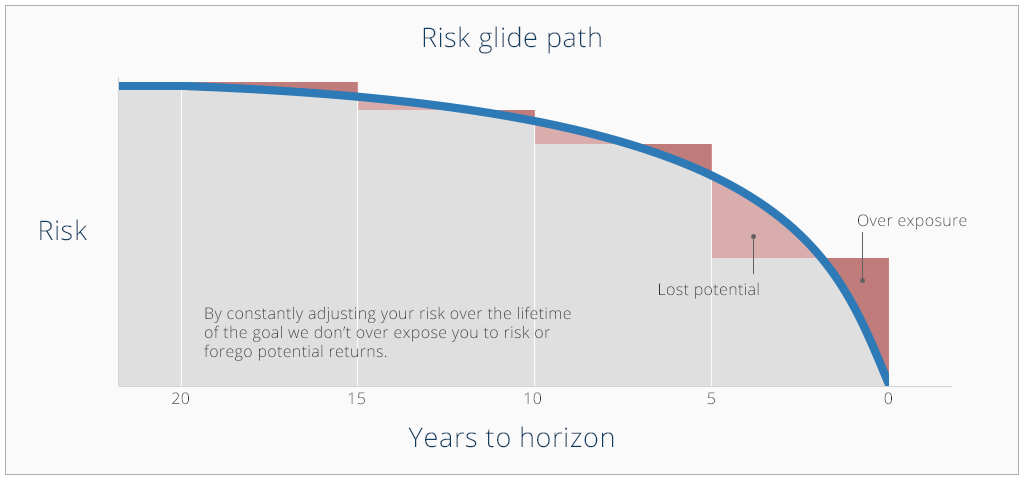
(Charts are for illustrative purposes only and no based on real numbers)
3.3. Custom Portfolios
Custom Portfolios allow our clients complete control over their desired asset allocation. We present the exact same asset classes and regions we use to construct all our portfolios, but allow clients to select their own target percentage weight in each. The underlying ETFs are still chosen by us, as discretionary manager, and are the same as the ones used in the rest of our client portfolios.
The target weight percentage of each asset class can be changed at any time, allowing more freedom to express long-term investment views.
With Custom Portfolios, someone with a specific investment view or desired asset allocation can easily construct a portfolio. Individuals with a bias (both positive and negative) towards a particular asset class or region can overweight or underweight that ETF to match their chosen investment view. The management and implementation of that asset allocation is then simply handed over to us.
The disadvantage of the Custom Portfolios is that a client would have to know which asset classes and combination thereof (the risk profile) are suitable for them. Individuals with strong investment views could also change their asset allocation frequently. However, this could not always be to the benefit of their long term investment goals and would require someone with knowledge and expertise in asset allocation.
4. Instrument Selection
As mentioned in our principles, there is ample evidence that shows that asset allocation has far more of an impact on your returns than what specific funds or ETFs you pick within any given asset class.
The indices that we have selected to represent each each asset class have, in most cases, multiple ETFs tracking them. So how do we choose which one to use?
There are objective criteria that can be used to prioritise which ETF would, ex ante, most likely be a more appropriate selection than others. The criteria that we use include, in no special order of priority:
| Criteria | Comment |
|---|---|
| Issuer | This looks at the issuer of the ETF. Their track record, credibility & reputation, how many assets under management (AUM) do they have? |
| AUM & Age | How long has the ETF been around for and how large is it in terms of AUM? If it is relatively new and with relatively low AUM? How serious do we judge the issuer to be? How large a share of the ETF’s AUM are our clients likely to represent? |
| Total Expense Ratio | How expensive will the ETF be over the longer term? |
| Tracking Error & Tracking Difference | How good a job does the ETF do at tracking its index? |
| Distribution Policy | Does the ETF distribute the dividends it receives, and, if so, how frequently? |
| Tax Status | Does the ETF issuer report the relevant tax information for it to be eligible to be included in tax wrappers? |
| Tax Domicile | Where is the ETF domiciled, and what are the tax treaties between the ETF’s country of domicile and the countries where the underlying assets are domiciled? How does this impact the taxation of dividend distributions? |
| Accounting Currency | How well does the ETF’s internal accounting currency match the currencies in the countries where the underlying assets are domiciled? |
| Trading Currency | Does the ETF trade in the currency of the portfolio in which it is to be held or would there be the potential for inefficiencies due to currency exchange? |
| Listings | On what exchanges does the ETF trade? |
| On Exchange Liquidity & Spreads | How liquid is trading in the ETF on the exchanges where it is listed? How costly would it be to trade on said exchange? |
However, it is worth to keep in mind that not only is it likely that the relative ranking of ETFs replicating any given index may change over time, but there are also client or portfolio specific circumstances that may make it so that the ETF with the “highest” objective ranking is not the best choice for a given client.
In line with ETFmatic’s objective of personalising each client’s portfolio, our platform is able to handle multiple ETFs tracking each index, and to switch between them for a given client’s circumstances. Below is an overview of the ETFs that we currently use to track the different indices.
5. Ongoing Portfolio Management
So far we have provided details around how we construct the target allocations for our different portfolios. In this section we describe how we actually manage them on a day-to-day basis.
5.1. Updating Target Allocations
For Investment Plans, we do weekly refreshes of new data into our investment engine in order to generate new target allocations for each of the combinations of our three dimensions: Exposure, Patience, and Time Horizon.
Starter Portfolios have static asset allocations that are reviewed and update once per year. The target allocations of Custom Portfolios are defined by the client, who also ecides how frequently to change the target
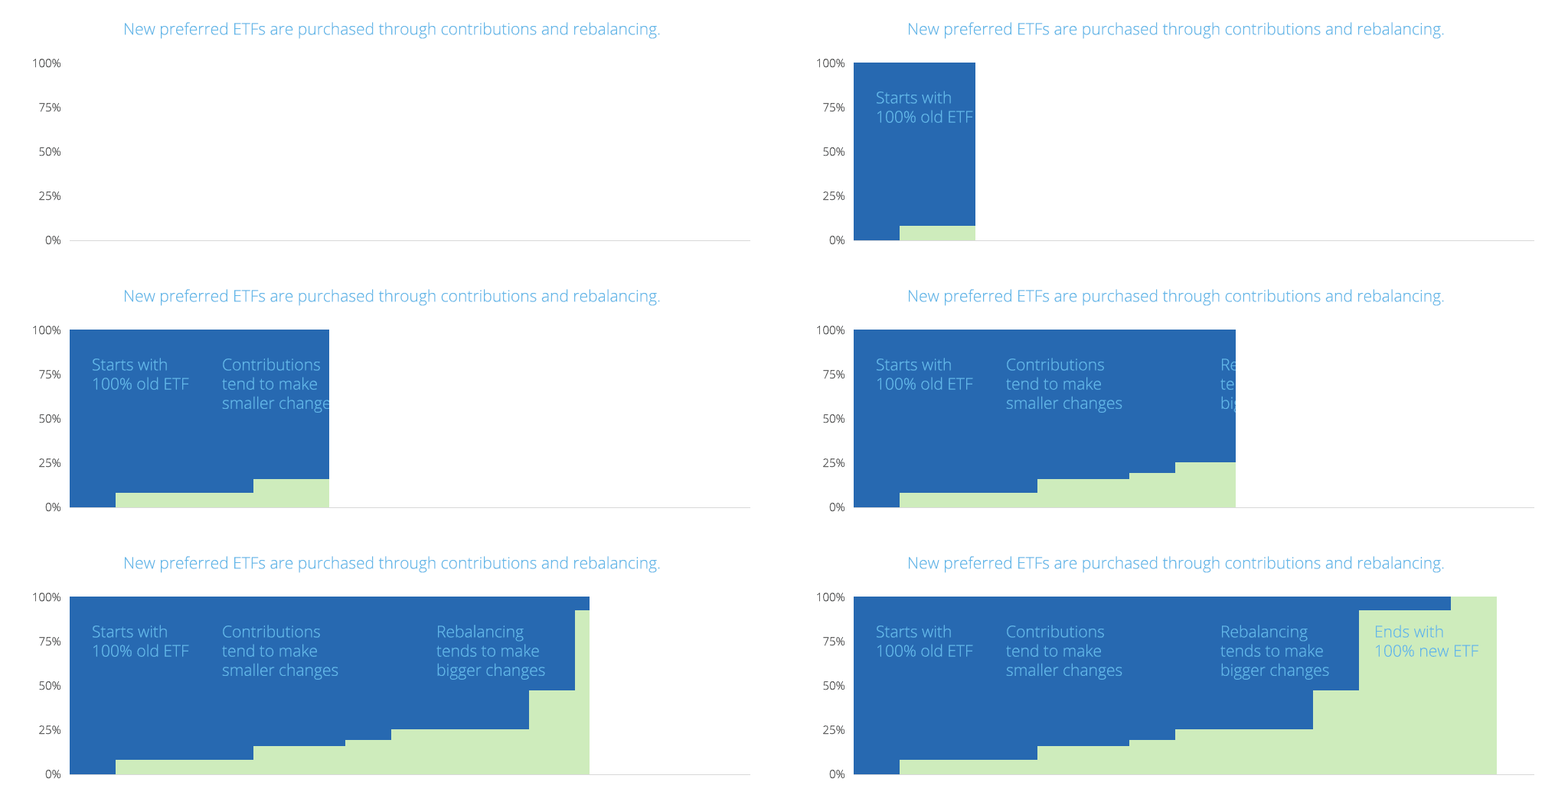
We calculate the best way of investing the funds to get each portfolio as close to the target allocation as possible.
5.2. Portfolio Rebalancing
Our three portfolio offerings all have target weights for the different asset classes:
- With our Starter Portfolios these weights are updated once per year to reflect changes in the market caps of the different indices.
- Investment Plans have dynamic target weights.
- The target weights of Custom Portfolios will change if a customer decides to change their asset allocation or liquidate their portfolios.
In deciding our rebalancing methodology, we reviewed several research papers that delved into the ideal frequency and best methodologies for rebalancing. We looked at the assets we use to construct our portfolios in terms of trading and settlement cycles. We considered the frequency of our asset class price feeds updates. We also verified the various preferences our Investment Plan clients set, as all of these drive potential portfolio adjustments.
With this in mind, we have implemented a portfolio rebalancing methodology that uses twice weekly and semi-annual looks along with set tolerance bands and inner rails relative to a portfolio's target weight.
5.2.1 Tolerance Bands and Inner Rails
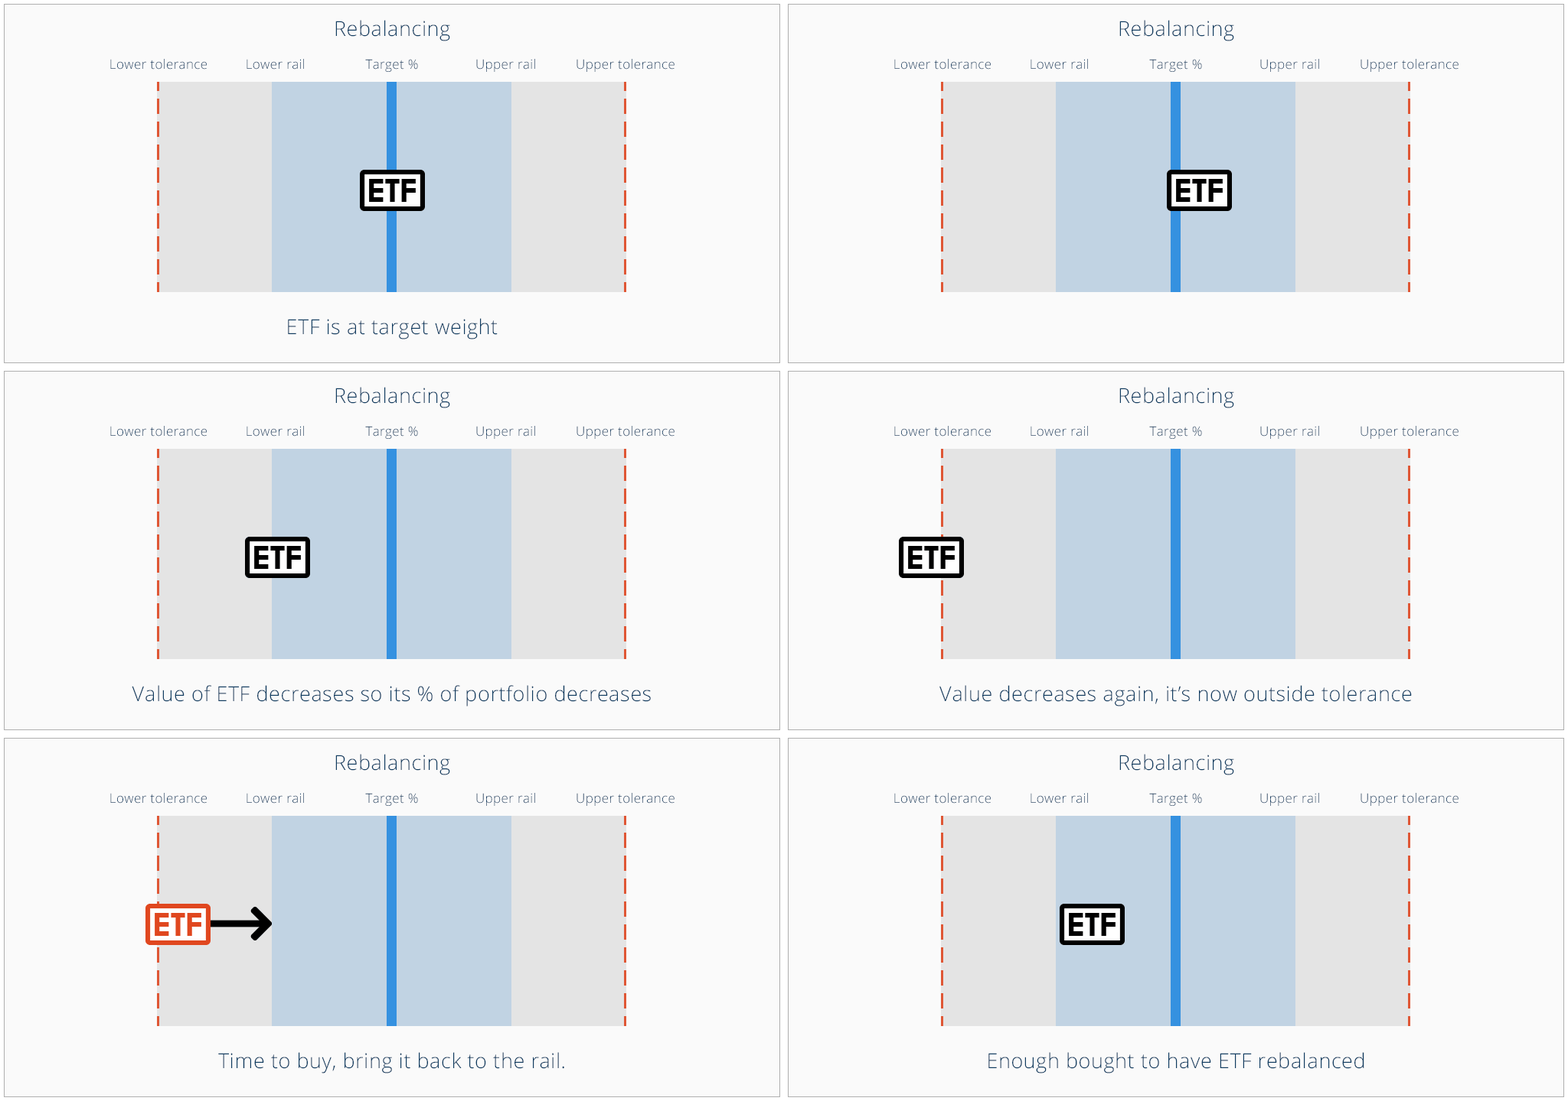
Being dogmatic about rebalancing a portfolio back to its target weights can often generate unnecessary trades where the tax implications outweigh the benefits of bringing the portfolio back to the exact target weights. Research suggests that a better way to manage rebalancing is to allow portfolios to drift slightly from the target allocations before assets are sold off in order to bring the portfolio back to target.
How far from the target a portfolio is allowed to drift is commonly referred to as the “tolerance bands”. Our aim is to set tolerance bands in place that are wide enough to allow for natural drift to occur and prohibit costly frequent rebalancing, whilst narrow enough so that the portfolio’s asset allocation mix adheres to the long-term chosen risk profile.
The same research also suggests that, when selling off assets to rebalance, it is possible to be flexible about how close the portfolio should be brought to the target weights to further minimise the implicit and explicit costs of trading. This flexibility is bounded by what is usually referred to as the “inner rails.”
We have chosen to set tolerance bands that are 20%, on a relative basis, on either side of a portfolio’s policy weight. We have further chosen relative weights of 10% for what we define as inner rails. These percentages were used and they were most compelling in the research in terms of portfolio returns, frequency of trades (reducing costs) whilst adhering to a portfolio’s policy weights.
We use our upper and lower tolerance bands to trigger rebalancing and our inner and upper rails as the points to rebalance to. Rebalancing to inner and outer rails rather than the exact policy weights will hopefully ensure trades (implicit and explicit costs) are minimized whilst the policy weights and risk profile of the portfolio is strictly maintained.
The tolerance bands and rails define what triggers a rebalance but do not determine when it is to be reviewed and implemented. There is a variety of research on how often a portfolio should be rebalanced. Given our focus on costs, we have segmented our frequency of rebalancing for portfolios as follows:
5.2.2 Portfolios of GBP, USD, EUR 25000 and above
We looked at the minimum size of trades and potential frequency and decided for portfolios in this bracket to implement a twice weekly look or investigation policy. This means that twice per week we compare the live weights of each portfolio (= individual portfolio holding a balance of 25,000 EUR, GBP or USD and above) to lower and upper tolerances and, if necessary, take action to bring the live weights to the inner rails if possible. The timing and frequency of this process also fits in with the schedule for updating the target weights for our Investment Plan portfolios as well as with our overall trading schedule.
We have deliberately implemented wider tolerance bands (20%) and more frequent investigation (twice weekly) to ensure that we do not necessarily rebalance frequently (keeping costs to a minimum), but that, given extreme market movements, we can adjust portfolios accordingly. This also helps to further ensure that Investment Plans with low Patience settings adjust their asset allocation in line with the client’s stated preferences.
5.2.3 Portfolios below GBP, USD, EUR 25000
For portfolios below our threshold amount, we have deemed that the size of the trades and the costs involved do not justify a frequent look methodology.
Furthermore, a portfolio that is built through small monthly contributions and dividend payouts on existing holdings will often only reach the chosen target asset allocation over time. In this instance rebalancing would have no benefit besides adding costs.
For this segment of portfolios we have therefore implemented a semi-annual look and rebalancing methodology. We use the exact same tolerance, inner rail bands and rebalancing logic. This means that on a semi-annual basis we will compare all portfolios of less than the threshold amount to their tolerance bands. Any live weights outside of tolerance are brought back to inner and outer rails where it is possible to do so.
5.3. Trading
Once we have generated the instructions for what trades we should do on each portfolio, we move on to executing those instructions. We first do an internal netting and aggregation of the instructions and then we go to trade the net demand or supply in the market.
Client Account Internal NettingWe look at each client account to see if it has multiple portfolios, and if so how much of the rebalancing can be done by moving money and assets between the different portfolios. Since this is all done within the same account, it does not trigger any tax consequences.
Global Aggregation and NettingSecondly, we look at to what extent we can net off transactions across client accounts. This has the benefit of reducing the volume we need to place into the market, thereby reducing both explicit costs as well as our overall impact on the market pricing of the ETFs (the implicit costs) we trade in.
Trading
After netting and aggregating, we take the remainder and send orders to market. Currently, we trade in the market at least twice per week. The price we get when trading in the market is also the price that is used for the internal netting.
The day after we have completed all the trading we send all our clients a transaction report summarising exactly what trades we did on their behalf.
We also ensure that each portfolio receives its’ due dividends and that the clients are properly informed of the dividend distributions that their portfolios receive.
5.4 Fees & Portfolio Administration
FeesWe only charge fees for the assets we manage on your behalf. Currently we manage all your investment portfolios for only 0.5% per year or less . We do not charge our clients any additional transaction, custody or maintenance fees.
As part of our commitment to transparency we also send all our clients monthly summaries of fees so that it’s clear exactly what we charge for the service we provide.
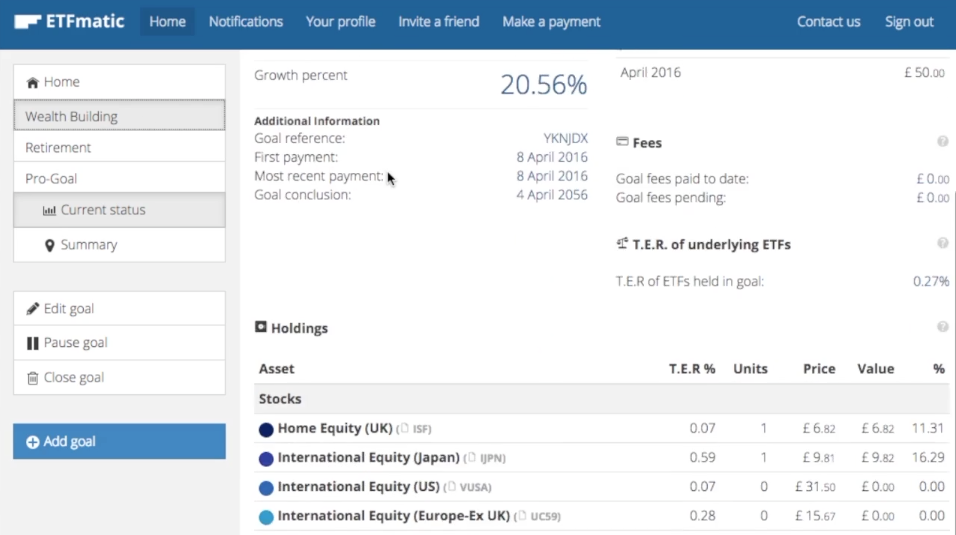
ReportingWe provide our clients monthly account statements. These statements detail exactly what ETFs are held, and the number of units and valuation of each holding. We also provide a summary of the previous month’s movements, including how much new money was invested in the account, how much was received in dividends, the impact of our fees, and finally, how much the account changed in value due to fluctuations in market prices.
At the end of each tax year we also send out a consolidated summary of all purchases, sales and dividend payouts, which can be used by each client to complete their tax filings.
5.5 Liquidation of Portfolios and Withdrawals
We recognize that sometimes the unexpected happens and a client will want to liquidate a portfolio ahead of plan. Or, in the case of Starter or Custom Portfolios, simply liquidate the portfolio. When that happens, we will sell off the assets held in the portfolio the next time we trade in the market and transfer the proceeds back to the client’s bank account. Due to the trading cycles we currently work with, this can take up to 6 working days depending on when the client requests the liquidation and withdrawal.
We do not charge transaction or transfer fees to clients when they withdraw their money or liquidate their portfolios.
6. Our App
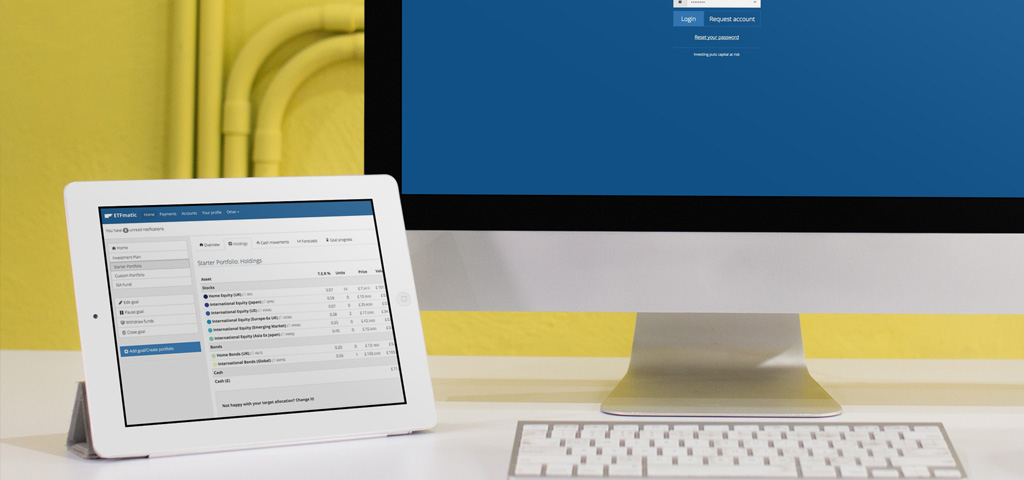
Thanks to our App, which is available for mobile devices, you can access information about your savings and update your settings at any point. Now you can also create an account in under 5 minutes.
If you would like to learn more about us before investing real money, you can watch our video or open a simulation account with your Android, iOS or Windows device.
(Past performance doesn’t guarantee future performance)
7. Frequently Asked Questions
Investment Approach
- How do you handle dividends?
- I am not a UK resident. Are my investments still covered by the Financial Service Compensation Scheme?
- How do you construct my portfolio?
- Can I pick my own ETFs and/or allocation model?
- What are your investment cycles?
- Do you offer portfolios based on Ethical investment themes?
ETFs
- Are ETFs secure?
- How do we select ETFs?
- What are the fund costs?
- What is a robo-advisor?
- What is an ETF?
- Why do we use ETFs?
Administration/ Opening Account
- Can I also open a Euro account?
- Can I open an account as an US citizen?
- How does the account opening process work?
- If I create multiple goals do I have multiple accounts with ETFmatic?
- In which countries are you authorized and where can I find the confirmation of this authorization?
- In which countries does ETFmatic offer its services?
Payments & Transfers
- Can I get my money back if I change my mind?
- Can I open a EUR/GBP account but fund it with GBP/EUR or another currency?
- Costs and how to make a transfer to my EUR account?
- How are my fees calculated?
- How can I change my monthly contributions?
- How can I transfer money to my ETFmatic account?
 Internet Explorer

